90 Day Security Challenge: Day 1
Welcome to my blog series about my journey through the 90 Day Security Challenge. My goals for this series is as follows:
- Accountability for myself to complete it.
- Have proof that I learned something.
- Have fun
Rules of the Challenge
The text below is taken from the email that got sent to me when I accepted the challenge. Here’s a link to sign up if you’re interested: 90-Day-Challenge
This program features 9 challenges with 3-5 tasks each to build your skills in Security Investigation, Threat Hunting, Forensics, and more.

Challenges Include:
Each challenge is expected to be completed in 10 days.

1️⃣ Ubuntu Security Investigation with Splunk
2️⃣ Windows Security Investigation with Splunk
3️⃣ Ubuntu Security Investigation with ELK SIEM
4️⃣ Windows Security Investigation with ELK SIEM
5️⃣ Malware Traffic Analysis using Wireshark
6️⃣ Practical Threat Hunting
7️⃣ Endpoint Forensics & Compliance Audit
8️⃣ AWS Cloud Threat Detection & Response
9️⃣ Hands-on Web App Pentesting
It might take me longer or shorter than 90 days, but I will my best to break up what I did day by day. Here’s a quick breakdown of what I’ll write about:
- Challenges faced
- Observations made
- Successes and how I felt </strong>
Challenge 1: Lab Set-Up

An accurate representation of how I felt doing this
Lab Goal: Install Splunk Enterprise Server and Universal Forwarder and Configure Them to Work Properly
Perhaps the photo above is a bit of an exaggeration. I’ve gotten pretty good at setting up VMs and I have a bit of knowledge with Splunk. My frustration stemmed from configuring the Splunk Universal Forwarder. It turns out your forward-server IP address is from the same machine the Forwarder is installed, not the one where Splunk Enterprise is installed. A simple mistake had me googling and reading forums like a madman for no reason.
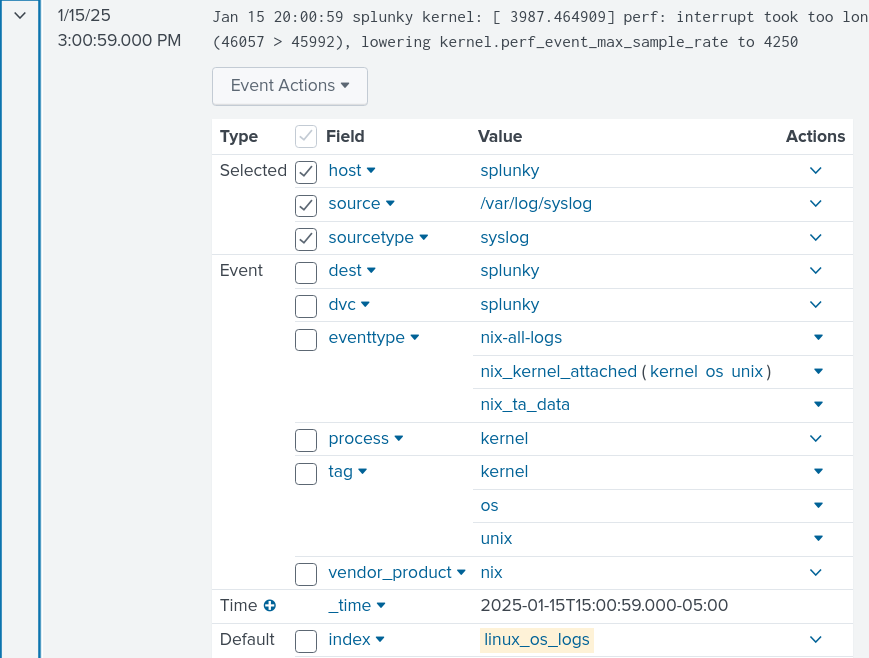
Something that I thought was cool was the creation of custom indexes. For example, I created one called linux_os_logs. To make this index actually appear in Splunk, you have to create file called inputs.conf located in /opt/splunkforwarder/system/local. Inside inputs.conf, you put the following text:
[monitor:///var/log/syslog]
disabled = false
index = linux_os_logs
sourcetype = syslog
As a result of this, anything coming from syslog gets labeled as linux_os_logs. This can be great for organizations that want to customize how Splunk displays its findings.
 As you can see, the index is labeled as
 linux_os_logs while monitor and sourcetype match the text block above.
The last part of the lab set-up involved installing two Splunk Apps, but I haven’t really used them yet. I can write more about them as the days go on.
With the lab set-up complete and running, i am now ready to go onto Task #1: Detection of Unauthorized Access on Linux Blocked by Fail2Ban.